Profiling Rust memory usage on with Instruments on macOS
note: this is very old. For simple profiling on macOS, check out cargo-instruments.
I’ve been playing around with Rust for the past month, and really enjoying myself. I’ve been especially happy with the community, and with how easy it is to find helpful people & information, and in that spirit I wanted to quickly explore something I wasn’t able to find elsewhere: memory profiling of a Rust application using Instruments, which is part of Apple’s Developer Tools.
Installing Instruments
To use Instruments you will need to install Xcode and the Xcode command line tools. These are freely available from developer.apple.com.
Set up your rust project
There is one big initial barrier to using instruments to profile Rust: Rust ships with its own memory allocator, which means Instruments cannot do fine-grained analysis. To get around this, you will need to switch to the system allocator. This involves installing nightly Rust. Don’t let this intimidate you. Thanks to rustup this is painless, and you can easily switch back to stable when you’re done: this is as easy as rustup default nightly and rustup default stable.
Then just add the following two lines to your crate root:
!#[feature(alloc_system)]
extern crate alloc_system;
Now Rust will use the system allocator.
If your project is not an executable
You will also need an executable to run: I wanted to profile a library, so I added a new binary crate inside my library crate with cargo new --vcs none --bin memcheck. Note --vcs none is because I don’t want this crate to have it’s own git repo. I included the parent crate to the Cargo.toml dependencies section, with parent = {version = "*", path = ".." }, and then I added a very simple main function that called some library functions that I suspected might have been leaking memory.
Command line profiling
Build your executable
To profile you will need to bulid your executable. Depending on what you’re debuging you may wish to use a debug or a release build, in which case the cargo docs explain what to do: if you’re happy with a debug build, then a bare cargo build will be fine.
Profile your executable
Instruments is able to perform a bunch of different tasks, called ‘templates’. In general the built in templates have always worked for me. For memory usage, there are two templates in particular that are useful: Allocations and Leaks. The first tracks a process’s use of anonymmous virtual memory and the heap, and provides a really useful call tree that shows where in your program allocations occur.
There are various ways of invoking the instruments command line tool; for a good overview check out Profiling an Application in Mac OS X.
In my case I wanted to capture the entire execution of my program, so I used instruments -t Allocations -D allocations ./target/debug/memcheck. The -t flag specifies which template to run, and -D specifies a place to store the generated trace. The last argument is just the path to your executable.
Interpret your results
From your terminal, open allocations.trace (where allocations is the path you passed with the -D flag above) will launch the instruments GUI, and you’ll have a window that looks something like this:
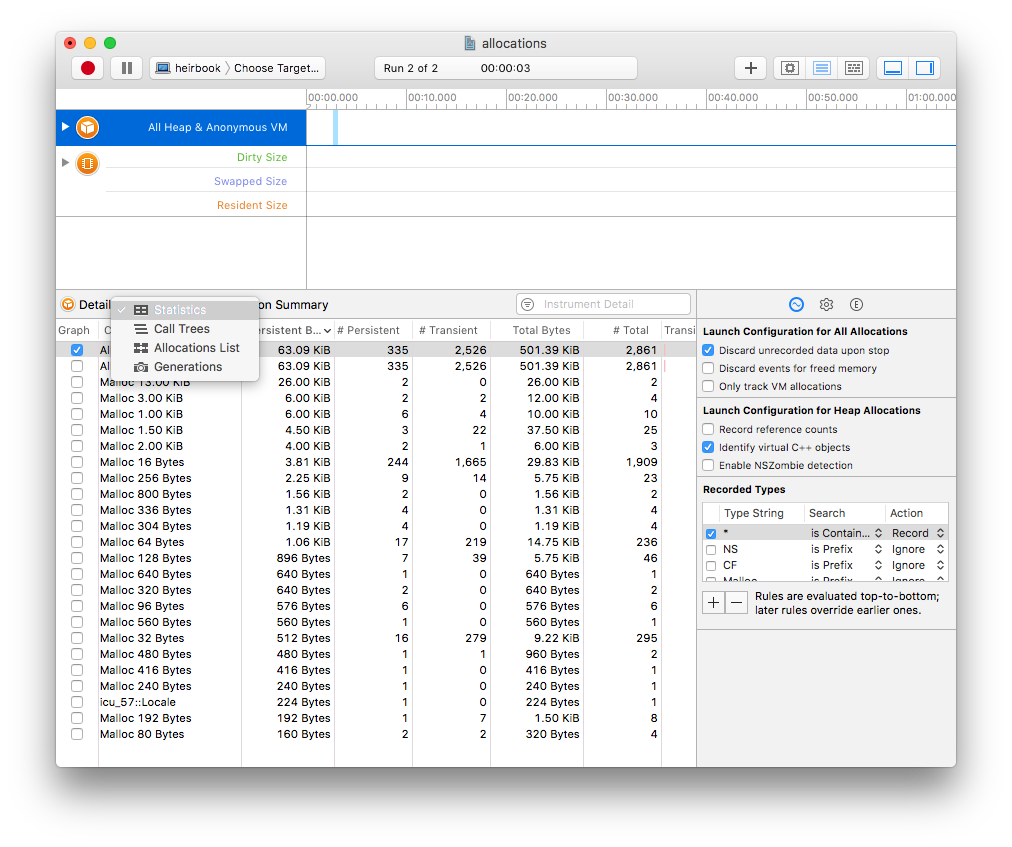
In general, the most useful part of the allocations template is the ability to look at call trees. If I select that, I get something that looks like this, which shows in an intuitive way exactly where in my program memory is being used.

More resources
Instruments is powerful tool, and a full explanation is beyond the scope of this post: but there is good documentation available, including some very good videos from WWDC over the past few years.